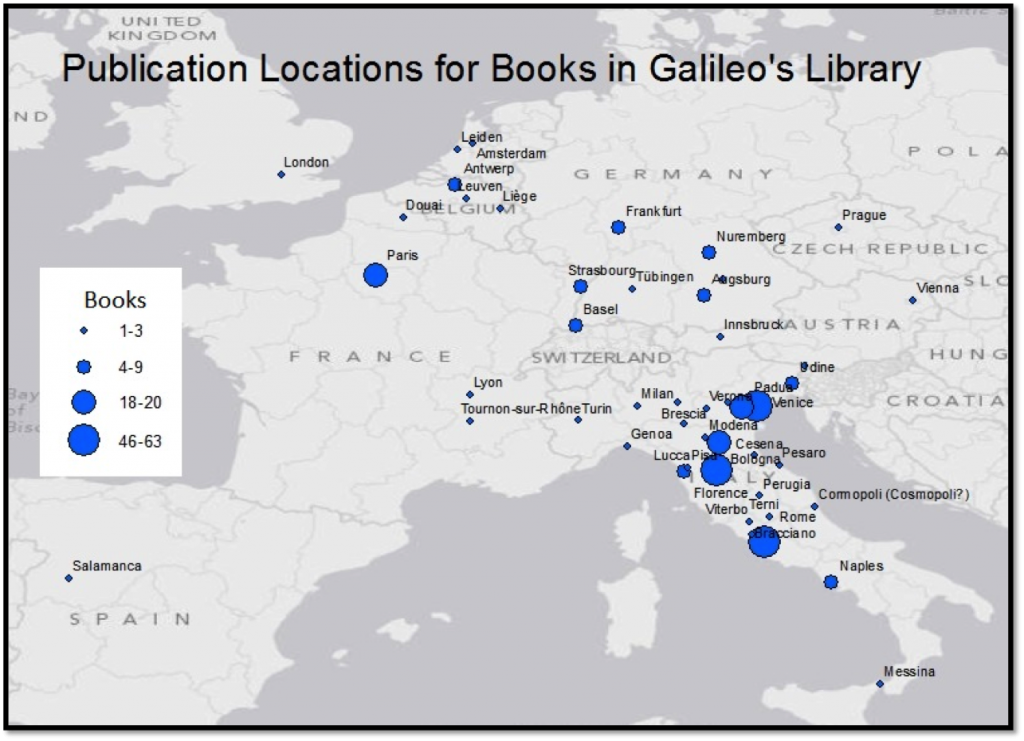
Map of the places in which editions known to have been in Galileo’s library were published. Visualization by Hannah Rafkin and Crystal Hall using ArcGIS.
Seeing the distribution of publication locations represented by the known half of the library reinforces the assumption that Galileo would have shopped locally in the places he lived or visited frequently: Florence, Venice, and Rome. At the same time, seeing the data on a map makes clear how far certain volumes traveled to reach him. Were they traveling so far because they were only published once, in a smaller printing center? What choice did he have? When combined with knowledge about the range of years in which these different editions were published, a more complete sense of the book choices that Galileo faced emerges, which is a collection of data that perhaps speaks more directly to the question of what his library represents.
Spatial statistics offer the mean center of data points as a way to assign a single value to a set of features, often population distribution. Although this is a useful way to compare information about different books, visualizing the average geographic information about the publishing history of Galileo’s works implies a Cartesian location from which they came, a visual element that is quite misleading. In Francesco Berni‘s case, his work was most frequently published in Florence and Venice, with a few editions appearing as far south as Rome and as far north as Tubingen. A mean geographic publishing center would then be Bologna, which is not one of the cities in which his books were printed.
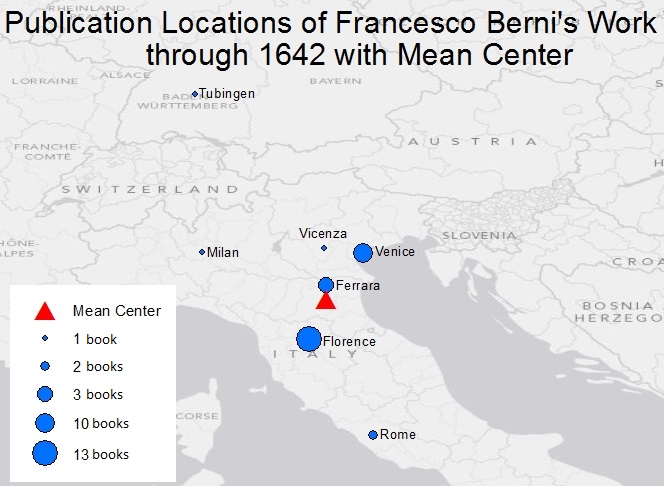
Visualization of the geographic center of locations in which Francesco Berni’s works were published during Galileo’s lifetime. Visualization by Hannah Rafkin and Crystal Hall using ArcGIS.
Since maps also require a level of specificity that early modern book data often does not provide, could we imagine a tool that presents the range of possible information without using a map, while still respecting known locations? The data on Francesco Berni offers one example of how this might appear when considered as a set of isotopes, which borrows its structure from standard graphs of chemical isotope characteristics.
Galileo’s Library General Information
Networks of People and Places