Gephi is an interactive visualization platform. It forms network connections based on the relationship of data inputs. Gephi is open-source, which means that anyone can access it and users can also help improve the Gephi’s design and functionality. Gephi can generate data visualizations for different kinds of networks, graphs, and complex systems. Gephi enables you to create visual representations of data that could uncover hidden network connections. Users can then understand the intricacies and underlying trends in graphs. The two basic elements of Gephi visualizations are nodes (essentially a data point) and edges (connection between two or more nodes).
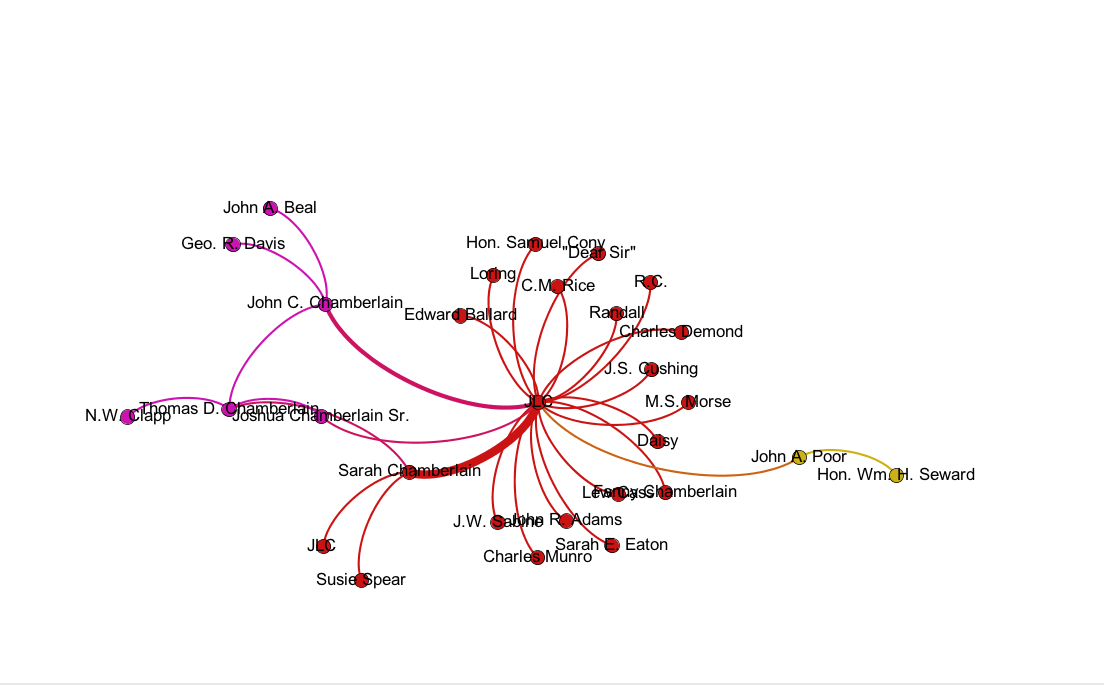
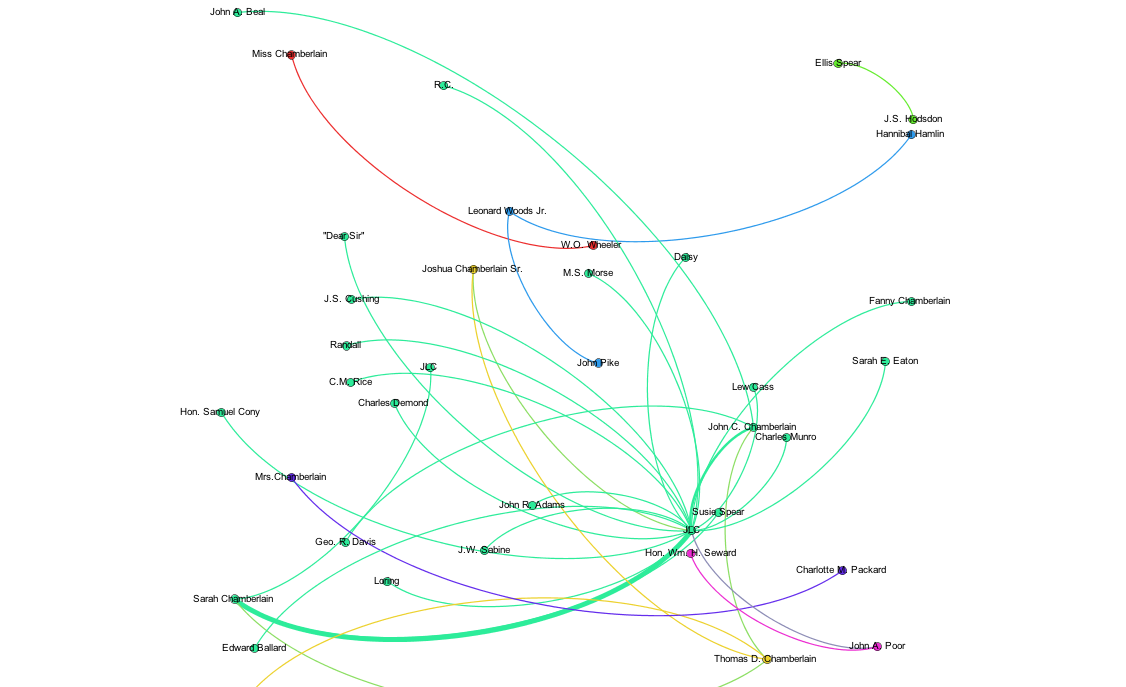
Gephi is already being used in DCS classes and projects at Bowdoin. This fall, students in Introduction to Digital and Computational Studies (INTD 1100) used Gephi to visualize Joshua Chamberlain’s correspondence network. The visualizations below represent Chamberlain’s overall correspondence during the Civil War. Students visited Bowdoin’s Special Collections and Archives to see the original Chamberlain letters and then created data visualizations in Gephi.
Further Reading: Visualizations and Historical Arguments by John Theibault.