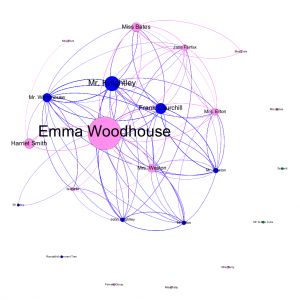
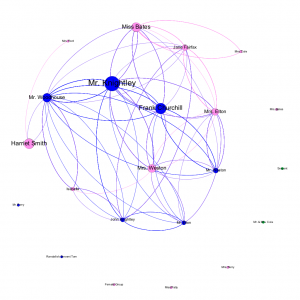
Unsurprisingly, Emma lies at the center of the novel, and consequently, its graph. Filtering Emma out of the above graph results in an edge visibility of 36.88 percent. The vast majority of conversations in the novel involve Emma, and this is evident by such a collapse of the graph. However, even without Emma, the other nodes on the graph are still connected to each other. Highbury maintains its structural foundation without her, but the novel inherently takes her point of view. The story cannot exist without Emma, but Highbury can. Franco Moretti performs a similar test in his graphical study of Hamlet, in which he removes Hamlet and Claudius, followed by Hamlet and Horatio. Moretti differentiates, “stability has clearly much to do with centrality, but is not identical to it” (Moretti, 5). Emma is central to the graph, but even with the resulting 36 percent edge visibility, the graph remains stable without her.
The out-degree of a node indicates the number of edges originating at that node, or in this context, the number of times that character speaks in the novel. Emma has by far the highest out-degree of any node at 360, while the second highest degree is Mr. Knightley at 151. Below that are Frank Churchill with 103, Harriet Smith with 93, and Miss Bates with 83. This ordering makes sense in the context of the novel, as Emma is our protagonist, and Mr. Knightley is her love interest and oldest friend. It may seem surprising that Frank Churchill ranks above Harriet Smith because he only arrives partway through the novel. Though Harriet is Emma’s constant companion, she is also rather quiet, while Frank is more social. Miss Bates appears less frequently than Harriet but has far more to say, explaining her out-degree of 91.
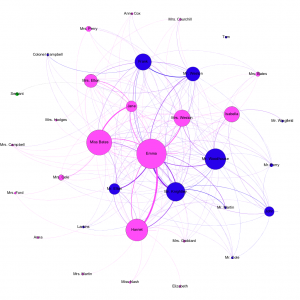
Consider the difference between this general graph of the novel and a graph of gossip in Highbury. Emma is certainly a prominent figure in Highbury society, but not to this extent. Harriet, too, is far more prominent in this graph than she is as a figure in Highbury. These graphs are, like the novel itself, inherently from Emma’s perspective. They show us gossip in Highbury as Emma sees it, but not in its entirety. This is a significant distinction in evaluating the data of Emma as well as understanding the novel. The structure of Emma’s plot depends on us reading from Emma’s perspective, and this bias carries over into the data. We only see what Emma sees, and consequently, our model can only show us social interactions as Emma witnesses them.
In order to generate this graph, every time one character says another character’s name, an edge appears between those two characters. If Miss Bates says the name “Jane,” an edge appears from Miss Bates to Jane. This method also takes into account name variations like “Miss Fairfax.” Generating the graph automatically has the disadvantage of ignoring any pronouns, so it certainly misses instances of gossip. In addition, addressing a character in the room then counts as talking “about” them.
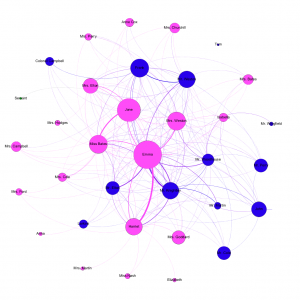
Note that female characters dominate the graph sized by out-degree, indicating that female voices dominate in Emma. However, the genders are more equally sized in the graph sized by in-degree, indicating that both men and women are the subject of gossip. This trend confirms the view of Emma as a female-dominated novel, in which female voices take a prominent role. It is also in line with the view of women as gossips, sharing information with one another in order to engage with the community.