• Skip to primary navigation
  • Skip to main content

Digital and Computational Studies Blog

Bowdoin College - Brunswick, Maine

  • Home
  • Research Opportunities
  • Courses
  • Events
  • Faculty and Staff
  • About the DCS Blog
  • Show Search
Hide Search

DCS-Related Graduate Opportunities

November 21, 2016 By Professor Crystal Hall

For any students who have taken DCS courses and are thinking about graduate study, here are a few institutions that are currently inviting applications:

University of California: MS and PhD in Computational Media

From their promotional materials: Computational Media is all around us — video games, social media, interactive narrative, smartphone apps, computer-generated films, personalized health coaching, and more. To create these kinds of media, to deeply understand them, to push them forward in novel directions, requires a new kind of interdisciplinary thinker and maker. The new graduate degrees in Computational Media at UC Santa Cruz are designed with this person in mind.

http://graddiv.ucsc.edu/prospective-students

https://www.soe.ucsc.edu/departments/computational-media

University of Amsterdam: MA in New Media and Digital Culture

From their promotional email: The MA Program in Media Studies: New Media and Digital Culture offers a comprehensive and critical approach to new media research, practices and
theory. It is an internationally renowned program in critical media theory, dedicated to the study of the social transformations brought about by digital culture. The program provides in-depth training in the latest digital research methods, with the opportunity to participate in data sprints and to collaborate with international researchers. It is situated within a pioneering new media cultural scene in Amsterdam and an academic environment ranked among the top 6 universities worldwide (QS World University Rankings by Subject 2016: Communication & Media Studies).

http://bit.ly/NMDC_Call1718

Duke University: MA in Digital Art History/Computational Media

From their promotional email: The Department of Art, Art History & Visual Studies offers a Master’s Degree in Digital Art History/ Computational Media. The eighteen-month program builds on courses and well-developed strengths at Duke University. The program requires 10 courses over three semesters in addition to summer research. Limited funding may become available in the form of grants and assistantships to students contingent upon positive progress in the program.

The Digital Art History track integrates historical disciplines and the study of cultural artifacts with digital visualization techniques for the analysis and presentation of research. This track prepares students for future work in such fields as art, architectural and urban history, public
history, city planning and architectural design, cultural heritage, museum exhibition design, and visualization-­based journalism, and provides a springboard for more advanced study in art history, archaeology, architectural history, and visual studies. More information:
aahvs.duke.edu/graduate/digital-art-history.

The Computational Media track is designed for graduate students focused on the study, creation, and use of digital media and computation in the arts and humanities. This track explores research and presentation strategies enabled by the information sciences, new approaches to computational processes, and new forms of interpreting quantitative and qualitative data. More information: aahvs.duke.edu/ graduate/ma-computational-media.

Illinois Tech: PhD in Technology and Humanities

From the recruitment email: I’m looking for PhD students interested in studying how citizens use social media to bring about social change in their communities to join the Collaboration
and Social Media Lab <http://casmlab.org> at Illinois Tech. We’re currently studying hyperlocal social networks, Twitter, Facebook, Instagram, and related social media platforms in order to understand social media’s role in civic engagement and to reduce cyberbullying. We use interviews, participatory design, machine learning, and natural language processing in
our research. Students in the lab will enroll in the PhD program in Technology and Humanities <http://humansciences.iit.edu/humanities/programs/graduate-programs/phd-technology-humanities>.
You can learn more about our social media and civic engagement project on the lab’s website <http://www.casmlab.org/research/>. This project is supported by the National Science Foundation <http://www.nsf.gov/awardsearch/showAward?AWD_ID=1525662&HistoricalAwards=false> and includes at least one year of full tuition and stipend support for qualified students.
Humanitarian Technology Conference 2016

August 4, 2016 By Professor Crystal Hall

DCS Co-director Crystal Hall sat down with Samantha Valdivia (Class of 2019) to talk about the Humanitarian Technology 2016 Conference in Boston, MA. DCS has established a small travel fund for students who wish to supplement their coursework with an experience at a regional conference. Using these funds along with mini-grant support from the Roberts Fund, Sam attended one day of the conference this summer.

Professor Hall: How would you describe the conference? Who was there, what were they doing, what did you do?

Sam: I attended the Humanitarian Technology Conference (HTC) on the second day of the three day conference. It was located in the Revere Hotel in Boston, Massachusetts. This environment was filled with innovators and intellectuals whose life work was to pursue philanthropic goals through the scope of technology. Involved in this conversation were professors, graduates students, military veterans, and representatives of private companies and philanthropic organizations like Microsoft, IBM, Oxfam, and the Electronic Telecommunications Cluster.

The HTC event sparked my interest because I desired to learn more about the different types of humanitarian efforts taking place in the real world. Although my interest in philanthropy has persisted for a while, I haven’t taken much action beyond a few isolated acts of service. Thus I was filled with nerves because I knew the real world of service is completely new territory. However, in the midst of the conference, I found that I was able to add my own undergraduate voice to the conversation.

Prof. Hall: How did the conference connect with your DCS coursework?

Sam: During my Data Driven Societies research, about whether community satisfaction increased if an NGO has access to Internet during natural disaster relief efforts, I learned about the Electronic Telecommunications Cluster (ETC). They implement technology necessary to create internet hubs for the NGOs. At the HTC conference I met a member of the ETC organization. I spoke to him about the 2015 earthquake in Nepal and their effort to implement internet hubs. I asked him about the struggles in supporting Nepal after the 2015 earthquake. He stressed that transporting the equipment needed to install internet systems for the NGOs was difficult because of Nepal’s geography. This incited an obstacle because the majority of funding would be invested in transportation. Later in the conference I spoke with a woman from Microsoft. We talked about Big Data’s influence in society and data scientist’s current search to represent it credibly. I spoke to her about the research I had done and asked her about the Hack for Humanity hackathons she organizes.

Prof. Hall: What advice do you have for anyone thinking about attending this conference or a similar event in the future?

Sam: If you’re interested in going to the Humanitarian Technology Conference next year, I highly recommend going all three days. This will give you a better grasp of the conversation taking place. Unfortunately I attended the event for only one day because of a scheduling conflict. Regardless, it was a memorable and insightful experience. Many thanks to Professor Hall for informing me about and helping me plan the Humanitarian Technology Conference trip.

Prof. Hall: Is there anything else you would like to add?

Sam: Beyond the conversations I had with different professors, graduates, and corporate staff, I noticed that all the speakers stressed in some way that there is a pertinent need for an umbrella organization to consolidate all the humanitarian efforts efficiently. There are bunches of organizations who desire to make change, but these efforts would be strengthened if there was an organization that was able to balance and bridge the corporate and academic desire to change the world. I discovered many things during this conference, however I was surprised at how much we diverted from the technology theme. The main focus seemed to be discovering a method to concentrate philanthropic energies into something more impactful rather than theoretical.

Under the Hood: HClust

July 28, 2016 By Professor Crystal Hall

In order to understand relationships between texts we often turn to the hclust function to create a dendrogram. This post will explain what is happening with that algorithm and how to explore its functionality with the built-in data on U.S. Cities. This tutorial can be used in conjunction with DCS 1200 “Data Driven Societies” and DCS/ENVS 2331 “The Nature of Data: Resource Management in the Digital Age”. Look for a Jupyter notebook with the R code so that you can follow along – coming soon!

One of the most frequent kinds of data used in text analysis is a distance matrix, which can be an odd configuration of information for users who aren’t used to working with a printed road atlas that would indicate the miles between different cities on a map. We’ll start with what is happening in two dimensions and then build on that to understand what is happening in the multiple dimensions of textual features that we measure.

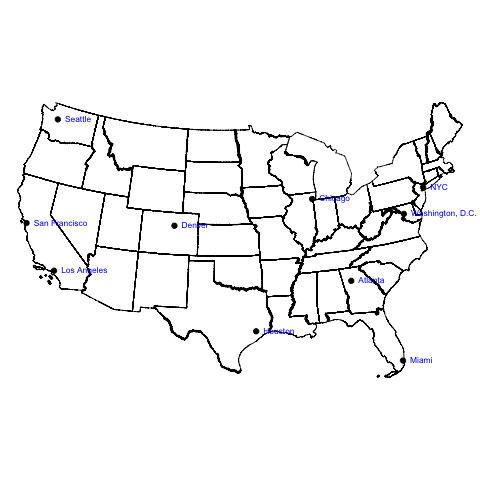
The sample data for our function hclust considers 10 U.S. cities and we want to find pairs or clusters of cities that are similarly distant to the other cities in our data set:

Map of the 10 cities analyzed in the hclust vignette. UTM-14 Projection.


Typically we would think about regions in order to categorize the cities: NYC, D.C. and maybe Chicago in the Northeast; Atlanta, Miami, and maybe Houston in the Southeast, etc. Hclust considers the linear distance between the points, seen here in the two dimensions of longitude (x-axis) and latitude (y-axis).


We would expect cities that are close together on the map to be similarly distant to the rest of the map. For example, San Francisco and Los Angeles on the West Coast are going to have relatively similar distances to cities on the East Coast. The distance between the cities can be represented as a matrix and we can see that San Francisco to New York is 2571 miles, LA to New York (or New York to LA in the data below) is 2451 miles, very similar:

Sample data from the hclust vignette.

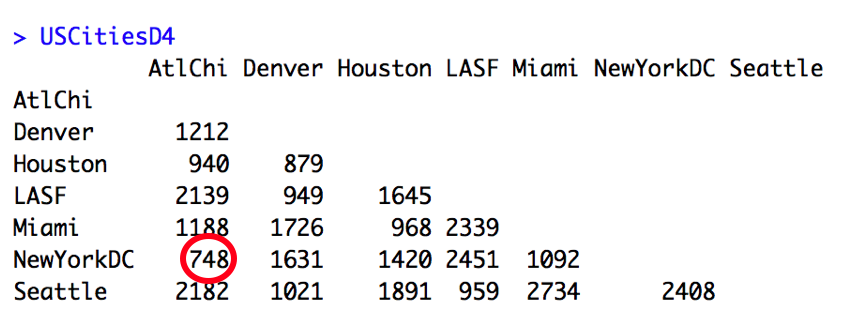
What happens when we compare each city’s distances to every other city’s distances? To find pairs like the obvious San Fran-L.A. cluster, we need to find cities that have a low difference in distances to each other, which by extension means finding similarly distant cities. We can think about our distance table as a dissimilarity matrix that shows the differences between the x and y values in our data (here the Euclidean or linear distance between two points).  The lowest value will help to identify the lowest dissimilarity, which establishes the first pair in the cluster.

Sample data from the hclust vignette with the lowest dissimilarity value indicated in red.


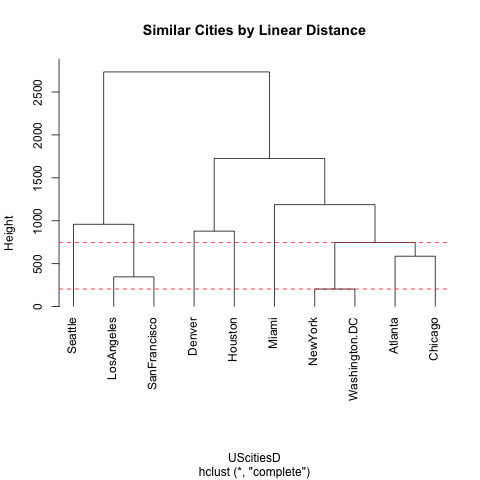
You will see that when we visualize the city clusters below in the final image, the New York – Washington, D.C. pair is together with a cluster height of 205 (indicated by a dashed red line). We can reduce our distance matrix to fewer columns by combining NY and DC. Using the complete or maximum linkage method we will keep the highest distance value to every other city in the data:

Distances from New York and Washington, D.C. to other cities. Maximum distance highlighted in red.

Our new distance matrix with the NewYork-DC cluster will look like the one below. Then we must keep searching for similarly distant pairs by finding the next two cities with the lowest distance between one another:

Distance matrix showing the new NewYorkDC cluster with values from above and the data that will determine the next cluster (circled in red).

Los Angeles and San Francisco will appear as a cluster connected by a horizontal bar at height 347 to indicate their dissimilarity. Once we repeat these steps a few times, our most similar (or least dissimilar) pair will be a pair of clusters:

Distant matrix showing that the Atlanta-Chicago and New York-Washington, D.C. clusters are the next closest pair.

This means that the Atlanta-Chicago and New York-Washington, D.C. clusters will be joined by a horizontal bar at the height of 748 to indicate their dissimilarity (distance). When we put everything together to view these clusters in a dendrogram, we can see these similarly distant pairs:

Dendrogram showing hierarchical clustering of US cities based on linear distance. Red bars highlight the height of the NY-DC cluster (the distance between the cities) and the height of the NY-DC, Atlanta-Chicago cluster (the maximum distance between any two members of the larger cluster).

We have rearranged our longitude-latitude (our x-y) data in such a way as to see new relationships. What happens when we apply this method to textual features? Instead of longitude on the x-axis, we might plot the relative frequency of the most frequent word (MFW) in our texts, and on the y-axis the relative frequency of the second most frequent word, and thanks to computation, we can continue this for 100 or 200 features (MFWs) into 100 or 200 dimensions. The algorithm then identifies the documents that are similarly distant, based on the same math that we have just outlined here. (You have seen this demonstrated in class and lab, but for another example, in a non-English language, see Prof. Hall’s work on computational parallax.) The biggest challenge is that we know a lot about the geographic space that separates cities and influences the features of those cities (although there is still much to learn), but we are only just starting to explore this computational aspect of the multi-dimensional space of texts.


Critical Bibliography on Databases

July 21, 2016 By Professor Crystal Hall

In Spring 2016, DCS alumna Gina Stalica (Bowdoin Class of 2016) completed an Independent Study of databases that involved critical reading, tool evaluation, and tutorial development. Shortly after she submitted her work, a lively discussion about readings on databases circulated through the Association of Internet Researchers (AIR) mailing list. AIR member Amanda Licastro compiled a public Zotero group on the topic after making the initial inquiry:

https://www.zotero.org/groups/database_dh

Here are a few highlights (some of which were covered by Gina’s work as well):

Dourish, Paul. “No SQL: The Shifting Materialities of Database Technology :
Computational Culture.” Computational Culture 1, no. 4 (November 9, 2014).
http://computationalculture.net/article/no-sql-the-shifting-materialities-of-database-technology

Driscoll, Kevin. 2012. “From Punched Cards to‘ Big Data’: A Social History
of Database Populism.” Communication+ 1 1 (1): 4.http://scholarworks.umass.edu/cpo/vol1/iss1/4.

Drucker, Johanna. “Database Narratives in Book and Online.” Journal of Electronic Publishing 18.1 (2015): n. pag. Web. http://quod.lib.umich.edu/j/jep/3336451.0018.113?view=text;rgn=main

IEEE Annals of the History of Computing Vol 29, Issue 3 (History of PC Spreadsheets):
http://ieeexplore.ieee.org/xpl/tocresult.jsp?isnumber=4338433

Liu, Alan. 2008. Local Transcendence: Essays on Postmodern Historicism and
the Database. Chicago, IL: University of Chicago Press.

Mackenzie, Adrian. 2012. “More Parts than Elements: How Databases
Multiply.” Environment and Planning D: Society and Space 30 (2): 335–50.
doi:10.1068/d6710.

Manoff, Marlene. 2010. “Archive and Database as Metaphor: Theorizing the
Historical Record.” Portal: Libraries and the Academy 10 (4): 385–98.

Price, Kenneth M. “Edition, Project, Database, Archive, Thematic Research Collection: What’s in a Name?” Digital Humanities Quarterly 3.3 (2009): n. pag.
http://digitalhumanities.org:8081/dhq/vol/3/3/000053/000053.html

Zwick, Detlev, and Janice Denegri Knott. 2009. “Manufacturing Customers The
Database as New Means of Production.” Journal of Consumer Culture 9 (2):
221–47. doi:10.1177/1469540509104375.

Pamela Fletcher Interviewed for LARB “The Digital in the Humanities” Series

July 12, 2016 By Professor Crystal Hall

In March 2016 journalist Melissa Dinsman began a new series for the Los Angeles Review of Books (LARB): “The Digital in the Humanities.” In late June LARB published Dinsman’s interview with Pamela Fletcher, Professor of Art History at Bowdoin and one of the founding co-directors of DCS. Professor Fletcher’s remarks highlight the value of humanistic inquiry of digital methods and objects as well as the ways in which a computational or digital approach can reshape the questions we ask of cultural objects. The piece is pleasantly provocative reading after the flurry of debate that surrounded an earlier LARB piece on digital humanities, which can be found along with links to responses in a summary post by dh+lib.


  • « Go to Previous Page
  • Page 1
  • Interim pages omitted …
  • Page 6
  • Page 7
  • Page 8
  • Page 9
  • Page 10
  • Interim pages omitted …
  • Page 20
  • Go to Next Page »

Digital and Computational Studies Blog

research.bowdoin.edu