• Skip to primary navigation
  • Skip to main content

Digital and Computational Studies Blog

Bowdoin College - Brunswick, Maine

  • Home
  • Research Opportunities
  • Courses
  • Events
  • Faculty and Staff
  • About the DCS Blog
  • Show Search
Hide Search

Jane Austen

Graphs – Volume 2, Chapter 8, To

May 19, 2017 By Phoebe Bumsted '17

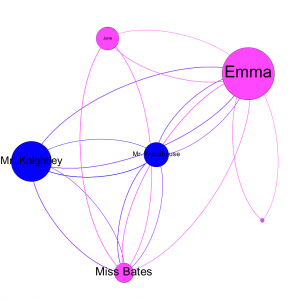
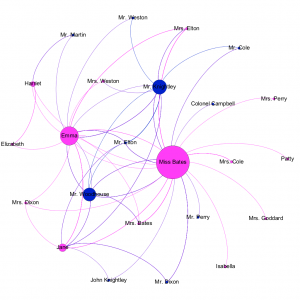
A manually interpreted graph of gossip in Volume 2, Chapter 8. Each edge begins with the character speaking and terminates at the character being spoken to. Female nodes are pink, and male ones are blue. The nodes are sized by out-degree, so characters who talk more appear as larger nodes.

As this chapter depicts a party, the flow of conversation was challenging to depict graphically.  The first, and arguably most significant speech in the chapter is when Mrs. Cole relates to a group of people the gossip about Jane Fairfax receiving a mysterious pianoforte.  Austen summarizes this passage but does not provide the exact words of Mrs. Cole’s relation.  Further, we know that Mrs. Cole is talking generally to a group, but we do not know exactly who is in that group.  The ambiguous nature of Mrs. Cole’s audience creates an atmosphere of general mingling and portrays Mrs. Cole as the deliverer of news and the source of the gossip.  For these reasons, I did not include this passage in the graph, even though it is the origin of all the gossip in this chapter.  However, there is one concluding piece of dialogue[1] from Mrs. Cole that does in some way manage to capture her role in the spread of gossip, if not fully.

Another important consideration in graphically representing this chapter was the consideration of time.  When reading Austen’s description of the party, one can imagine a relatively large group of characters mingling.  Characters move from group to group, listening, talking, and sharing gossip.  However, there are only two primary sections of gossip-driven dialogue in the chapter, one between Emma and Frank Churchill and the other between Emma and Mrs. Weston.  Portraying these conversations graphically does not fully capture the sense of time in the chapter.   For instance, someone interrupts Frank and Emma’s conversation, and they both mingle with other characters before reuniting and continuing their previous conversation.  Although the graph portrays this chapter as one continuous conversation, it is important to note the failings of a graphical portrayal of narrative.
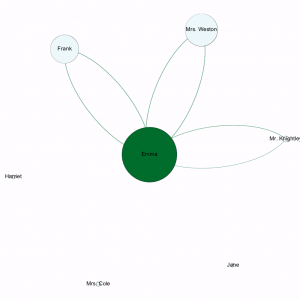
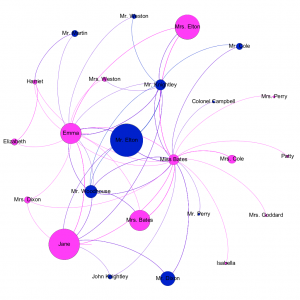
An automatically interpreted graph of Volume 2, Chapter 8. Nodes are sized by out-degree.

Note the significant difference between the automatically generated graph and the manually created one.  The manual graph much more clearly captures the flow of conversation as among characters, whereas the automatic graph is much more stark, with lines only from Emma to each character she interacts with.  This difference is likely due to a reader’s ability to detect nuances in conversation that the model for conversation performed by the automatic version cannot.  For instance, Mr. Knightley calls out to Miss Bates to stop Jane from singing for too long.  However, this piece of dialogue is not followed by a response from Miss Bates, so the automatic graph does not portray this interaction.

[1] “‘One can suppose nothing else,’ added Mrs. Cole, ‘and I was only surprized that there could ever have been a doubt. But Jane, it seems, had a letter from them very lately, and not a word was said about it. She knows their ways best; but I should not consider their silence as any reason for their not meaning to make the present. They might chuse to surprise her” (168-9).
Graphs – Volume 2, Chapter 3, About

May 19, 2017 By Phoebe Bumsted '17

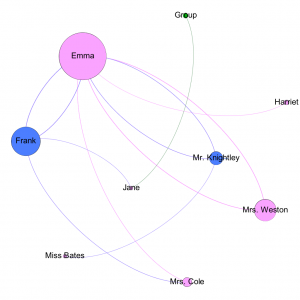
A manually interpreted graph of gossip in Volume 2, Chapter 3. Each edge begins with the character speaking and terminates at the character being spoken about. Female nodes are pink, and male ones are blue. The nodes are sized by out-degree, so characters who talk more appear as larger nodes.

Manually determining the character about whom other characters were talking proved to be a difficult and interesting task.  Mr. Woodhouse’s role in the conversation is particularly notable.  He almost never directly addresses the conversation, instead making observations such as, “Once, I felt the fire rather too much; but then I moved my chair a little, a very little, and it did not disturb me” (134).  Emma and Mr. Knightley are far more focused on the conversation at hand, while Mr. Woodhouse is far more likely to follow his own train of thought and provide only tangentially relevant observations.  This is evident in the graph, as Mr. Woodhouse’s network only includes the characters in the room, revealing his inability to engage in the wider conversation.  This characteristic is only evident on this small-scale graph.  Because the community of the novel is so small, Mr. Woodhouse’s is about the same as anyone else’s on the scale of the full novel.

Also notable in this chapter is the method by which the news of Mr. Elton’s engagement gets to Emma.  Mr. Elton has sent a letter to the Coles; Mr. Cole shares this letter with Mr. Knightley; and Mrs. Cole shares the information with Miss Bates.  Both Mr. Knightley and Miss Bates arrive at Hartfield to share the news with Mr. Woodhouse and Emma.  Mr. Knightley hints at the news, and I recorded this as talking “about” Mr. and Mrs. Elton, if not explicitly.  Miss Bates seems upset to hear that Mr. Knightley has heard this news before her – “Where could you possibly hear it, Mr. Knightley? For it is not five minutes since I received Mrs. Cole’s note” (136).  Miss Bates’s role is that of the town gossip, and she knows that her ability to spread information is her greatest social capital.

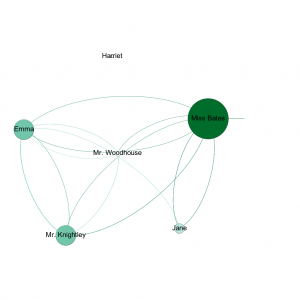
A manually interpreted graph of gossip in Volume 2, Chapter 3. Female nodes are pink, and male ones are blue. The nodes are sized by in-degree, so characters who are most talked about appear as larger nodes. Note that women are more responsible for circulating gossip in the previous graph, while men are more often the subject of gossip, as in this graph.

You can see the characters’ various roles displayed in the graph.  Miss Bates’s network, of course, has the furthest spread, as she routinely mentions five or ten characters in her long-winded passages.  Removing her from the network results in 56.03% edge visibility; approximately half of the graph relies on her, unsurprisingly.  Mr. Knightley, on the other hand, has a more contained reach.  He is focused on the people in the room and on Mr. and Mrs. Elton, the primary subject of conversation.  As a wealthy man, Mr. Knightley does not need to engage quite as fully in the network of gossip as Miss Bates does in order to hold social importance.  Emma’s network is more wide-ranging than Mr. Knightley’s but less so than Miss Bates’s.  Surprisingly, removing Mr. and Mrs. Elton from the graph results in a 75.86% visibility of edges, so the network largely stays intact even without any gossip about their marriage.  This is likely because the chapter opens with some conversation about other topics, and Miss Bates also mentions a variety of other characters in her gossip about the Eltons, so there is plenty of surrounding gossip to maintain the structure of the network.  This would seem to suggest that although Mr. Elton’s engagement is significant to the community insofar as it removes one eligible bachelor, the gossip of the town can and will continue regardless.

Graphs – Volume 2, Chapter 3, To

May 19, 2017 By Phoebe Bumsted '17

https://bowdoin.ensemblevideo.com/Watch/Austen1

A manually interpreted graph of gossip in Volume 2, Chapter 3. Each edge begins with the character speaking and terminates at the character being spoken to. Female nodes are pink, and male ones are blue. The nodes are sized by out-degree, so characters who talk more appear as larger nodes.

Consider the above graph, which portrays dialogue from one character to another in Volume 2, Chapter 3.  In this graph, each edge connects the character speaking to his or her audience.  Notable in graphically representing this conversation is the notion of time.  In this representation, each paragraph of dialogue is considered as one unit of narrative time, regardless of the length of the paragraph.  However, there is one instance in which Mr. Knightley and Mr. Woodhouse both jump to contradict Emma’s self-deprecation “nearly at the same time” (134).  This moment is represented in the graph as a simultaneous occurrence, rather than two separate pieces of dialogue.  Of course, this method of representing conversation over time is inherently flawed, as it is dependent on textual units of time.  A paragraph is not in reality a unit of time, but instead a unit of textual organization.  However, for the purposes of representing an inherently textual interaction, this method does reveal the way a conversation moves between characters.

Another difficulty in representing conversations between people is the notion of generally addressing the room.  Emma does this quite a bit when Miss Bates appears.  For instance, the statement “Mr. Elton going to be married! He will have everybody’s wishes for his happiness” is not directed at any particular character, but rather the entire room (136).  This is particularly difficult to capture graphically, as here Emma is not really addressing Mr. Woodhouse, Mr. Knightley, Miss Bates, and Jane individually, but rather addressing the group as a whole.  This type of speech includes everyone generally rather than each participant individually.  This social convention is perhaps what makes Miss Bates’s and Jane’s tangent about the physical qualities of Mr. Dixon so uncomfortable.  The two have what is almost a private interaction in the midst of a public conversation, which is a jarring contradiction.  Miss Bates briefly fails to include everyone by only talking to Jane, and this reads as a break in the normal flow of conversation, if only for a moment.

A manually interpreted graph of Chapter 3, but nodes sized by in-degree.
An automatically interpreted graph of Chapter 3. Nodes are sized by in-degree.

In contrast with the manually generated graph is the automatically generated one.  In order to create this graph, I assumed that when each character speaks, the next speaker is the first speaker’s addressee.  For instance, if Emma speaks and then Mr. Knightley speaks, this graph assumes that Emma is speaking to Mr. Knightley.  This method of visualization draws attention to the characters speaking in a way that dialogue imbedded in the narrative does not, and it portrays that dialogue in such a way that nodes are either “on” or “off.”  Although this makes a whole set of assumptions about the nature of conversation and its role in the book, the above two graphs are rather similar.  Both are sized by in-degree, meaning that larger nodes are addressed in conversation more frequently.  The manual version of the graph shows more nuance in differentiating the sizes of the nodes, and Emma, rather than Miss Bates, becomes the dominating presence.  Mr. Knightley and Mr. Woodhouse are both also allowed greater share of the conversation, due to the phenomenon of addressing the group rather than the individual.  We may take from these differences that, although Miss Bates speaks frequently, she is less often explicitly addressed.  Further, although Mr. Knightley and Mr. Woodhouse are less frequent speakers, they are a significant part of the audience.  This is perhaps indicative of a difference in class, as the most prominent speaker is the poor old maid while the most common listeners are the wealthiest characters.  Those in power merely listen while Miss Bates takes advantage of her information to momentarily take the spotlight.

Graphs – The Novel

May 19, 2017 By Phoebe Bumsted '17

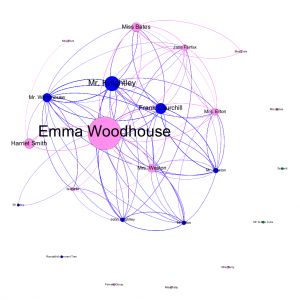
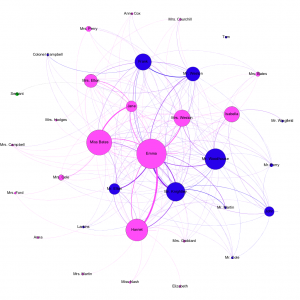
An automatically generated graph of interactions in the novel. Each time a character speaks, the next speaker is considered to be the recipient. Edges move from the character talking to the recipient. Nodes are sized by out-degree.
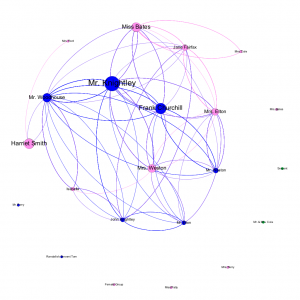
The same graph, but with the Emma node removed.

Unsurprisingly, Emma lies at the center of the novel, and consequently, its graph.  Filtering Emma out of the above graph results in an edge visibility of 36.88 percent.  The vast majority of conversations in the novel involve Emma, and this is evident by such a collapse of the graph.  However, even without Emma, the other nodes on the graph are still connected to each other.  Highbury maintains its structural foundation without her, but the novel inherently takes her point of view.  The story cannot exist without Emma, but Highbury can.  Franco Moretti performs a similar test in his graphical study of Hamlet, in which he removes Hamlet and Claudius, followed by Hamlet and Horatio.  Moretti differentiates, “stability has clearly much to do with centrality, but is not identical to it” (Moretti, 5).  Emma is central to the graph, but even with the resulting 36 percent edge visibility, the graph remains stable without her.

The out-degree of a node indicates the number of edges originating at that node, or in this context, the number of times that character speaks in the novel.  Emma has by far the highest out-degree of any node at 360, while the second highest degree is Mr. Knightley at 151.  Below that are Frank Churchill with 103, Harriet Smith with 93, and Miss Bates with 83.  This ordering makes sense in the context of the novel, as Emma is our protagonist, and Mr. Knightley is her love interest and oldest friend.  It may seem surprising that Frank Churchill ranks above Harriet Smith because he only arrives partway through the novel.  Though Harriet is Emma’s constant companion, she is also rather quiet, while Frank is more social.  Miss Bates appears less frequently than Harriet but has far more to say, explaining her out-degree of 91.

Consider the difference between this general graph of the novel and a graph of gossip in Highbury.  Emma is certainly a prominent figure in Highbury society, but not to this extent.  Harriet, too, is far more prominent in this graph than she is as a figure in Highbury.  These graphs are, like the novel itself, inherently from Emma’s perspective.  They show us gossip in Highbury as Emma sees it, but not in its entirety.  This is a significant distinction in evaluating the data of Emma as well as understanding the novel.  The structure of Emma’s plot depends on us reading from Emma’s perspective, and this bias carries over into the data.  We only see what Emma sees, and consequently, our model can only show us social interactions as Emma witnesses them.

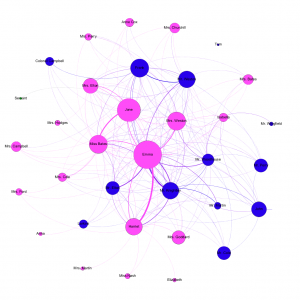
An automatically generated graph of gossip in the novel. Each edge points from the character talking to the character he or she is talking about. Nodes are sized by out-degree. Characters who speak more often appear as larger nodes.
The same graph sized by in-degree. Characters who are more often talked about appear as larger nodes.

In order to generate this graph, every time one character says another character’s name, an edge appears between those two characters.  If Miss Bates says the name “Jane,” an edge appears from Miss Bates to Jane.  This method also takes into account name variations like “Miss Fairfax.”  Generating the graph automatically has the disadvantage of ignoring any pronouns, so it certainly misses instances of gossip.  In addition, addressing a character in the room then counts as talking “about” them.

Note that female characters dominate the graph sized by out-degree, indicating that female voices dominate in Emma.  However, the genders are more equally sized in the graph sized by in-degree, indicating that both men and women are the subject of gossip.  This trend confirms the view of Emma as a female-dominated novel, in which female voices take a prominent role.  It is also in line with the view of women as gossips, sharing information with one another in order to engage with the community.

Methodology

May 19, 2017 By Phoebe Bumsted '17

The digital aspect of this project involves creating a visual network of communication using a combination of Gephi and R script.  The goal of this network is to visualize how information moves throughout the community.  I will visualize each character in the novel as an individual node and consider how they interact with one another.  Revealing this network will answer a number of important questions about the text.  Who has and shares knowledge, and who receives it?  How does that knowledge move between people?  Who is the object of the most gossip, and where does the gossip end?  Beyond the value of the model itself, the process of creating it raises a multitude of questions about the text.  We might consider how Austen structures the text around dialogue and narration and when the narrator interrupts sequences of dialogue.  Further, attempting to divide the text into units raises important questions about chapter divisions: Is there only one conversation per chapter? Do conversations ever last multiple chapters?  Why does Austen structure the text in this way, and what can we learn from it?  These are just a few of the questions that digitalizing Austen’s communities can raise.

My networks will track dialogue between characters.  However, digitalizing dialogue proved to be more complicated than it initially appears.  In considering creating a network of dialogue, one might expect to portray the characters as individual nodes with edges connecting them to show interactions.  However, how do we determine where the connection starts and where it ends?  Let us start with a basic example.  Character A is having a conversation with Character B.  We might digitize this with lines moving from A to B and back again for each piece of dialogue.  However, we might complicate this image by adding a third person, C, to the conversation.  When A speaks, is he speaking to B or C, or perhaps both?  How do we determine this?  One way may be to assume that the next person to speak is the one to whom the first character is speaking. Another would be to assume that each character is always speaking to all the characters in the group.  Both these methods pose problems in their accuracy.  Further, let us suppose that A, B, and C are gossiping about a fourth person, D.  How do we portray this connection?  Any automatic method of portraying gossip is inherently flawed, but considering these problems also helps us to consider how dialogue works in the text.

In my research, I discovered a project similar to my own entitled Austen Said: Patterns of Diction in Jane Austen’s Major Novels.  This project explores forms of discourse in Austen’s novels, most prominently free indirect discourse.  The researchers used XML markup to identify each passage in all of Austen’s major works by the speaker and the form of discourse (direct discourse, indirect discourse, or free indirect discourse).  The researchers have helpfully provided their marked up data on their website, and I will use this data in my own study of Austen’s novels.  Although Austen Said primarily focuses on free indirect discourse, their XML markup does provide information about who “says” each passage in the book, which I used in automatically generating my graphs.

I decided to digitally visualize the full novel as well as two individual chapters in greater detail.  I outlined the following steps for creating my graphs:

  1. Automatically generate a graph of gossip in the entire novel in which each character speaks to the next character who speaks, using the XML markup from Austen Said to identify speakers and listeners.
  2. Automatically generate a graph of each of the individual chapters of focus using the same method as in step 1.
  3. Automatically generate a graph of gossip in the entire novel in which each character speaks about any character they name in their dialogue. For example, if Emma mentions Mrs. Weston in her dialogue, I draw an edge from Emma to Mrs. Weston.
  4. Replicate step 3 for each individual chapter of focus.
  5. Manually create the graphs generated in step 2.
  6. Manually create the graphs generated in step 4.
  7. Add gender.

The first step of the project was to perform an initial analysis of the data for the whole novel.  This initial phase identified the speaker of each passage using the “who” attribute of the markup.  The next passage’s “who” attribute became the recipient of each passage.  This step ignores the narrator and characters speaking as each other, and it excludes any additional information, such as gender or social class.  This version of the graph is inherently flawed, as it makes a whole set of assumptions about the text, like the idea that each character is addressing the next character who speaks.  However, it provides a basic starting point from which to proceed.  As this step was almost entirely automated, I performed it first on the novel as a whole, and then on the individual chapters.

In order to accomplish this, my advisor, Professor Crystal Hall, provided me with a piece of code in R that identifies the tagged speaker of each passage and uses the following speaker as the recipient of that passage.  I ran this code using XML markup of the text and uploaded the spreadsheet into Gephi.  Then, I identified the characters I did not want to include in the graph.  These included the narrator, the narrator speaking as a character (indicative of free indirect discourse), and characters speaking as each other.  I wanted to see gossip as it occurs between characters, so though we might consider the narrator as a gossip in this novel, I eliminated her from the graph.  Additionally, I didn’t want “Emma as Knightley” to appear as a separate character in the graph, so deleted these unnecessary nodes.  Then, I rearranged the nodes in order to see them all individually.

The next step was to create a graph that shows characters talking about one another.  Again, Professor Crystal Hall provided me with an R script that searches for a list of character names and creates edges from the character speaking to those they speak about.  This script also accounted for time, considering one chapter as a unit of time.  I then developed the list of character names, making sure to include variations like “Jane,” “Miss Fairfax,” and “Jane Fairfax.”  In Gephi, I then combined nodes that were different names for the same character.  I performed this analysis on both the whole novel and each individual chapter.  I then performed each of the steps above manually for the individual chapters, manually creating my own Excel spreadsheet of my interpretations of the chapters.  Finally, I retroactively added gender as an attribute to all of my graphs so that I could color the nodes accordingly.

  • « Go to Previous Page
  • Go to page 1
  • Go to page 2
  • Go to page 3
  • Go to Next Page »

Digital and Computational Studies Blog

research.bowdoin.edu