• Skip to primary navigation
  • Skip to main content

Digital and Computational Studies Blog

Bowdoin College - Brunswick, Maine

  • Home
  • Research Opportunities
  • Courses
  • Events
  • Faculty and Staff
  • About the DCS Blog
  • Show Search
Hide Search

DCSI Event on Campus

November 10, 2015 By Gabriella Papper '18

Screen Shot 2015-11-06 at 12.11.40 AM

This week, there will be a Digital and Computational Studies Workshop.

Digital and Computational Studies Workshop

Tuesday, November 10th | 6 p.m. – 9 p.m.
Location: Room 304 (North), VAC
Open to the Bowdoin Community
Sponsored by the Digital and Computational Studies Initiative

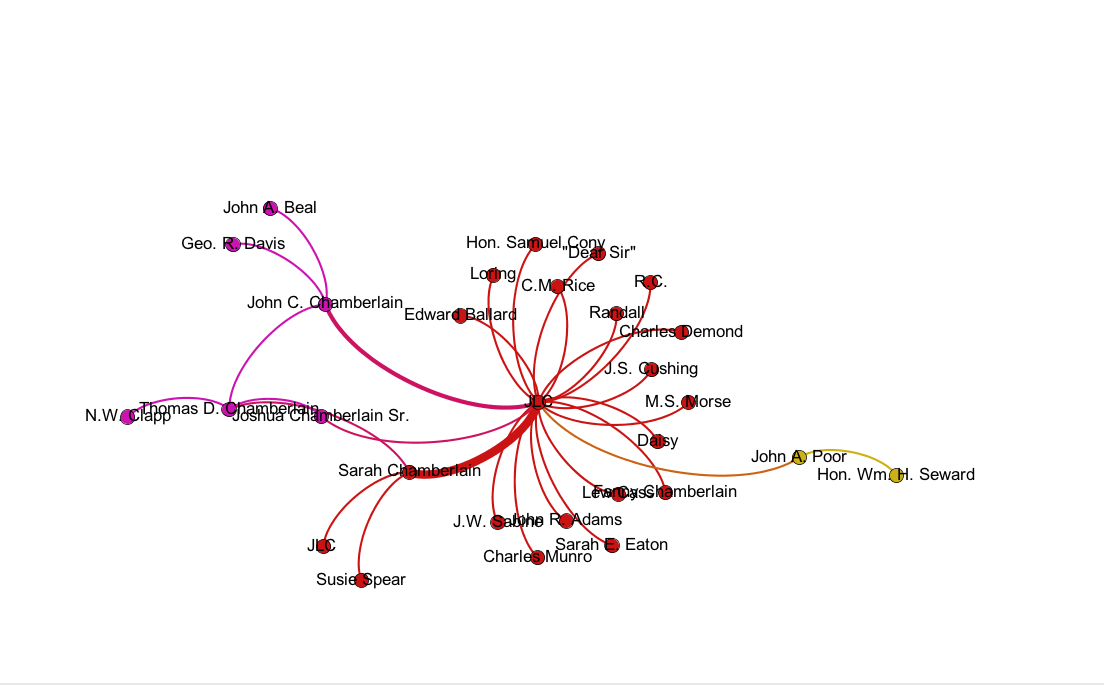
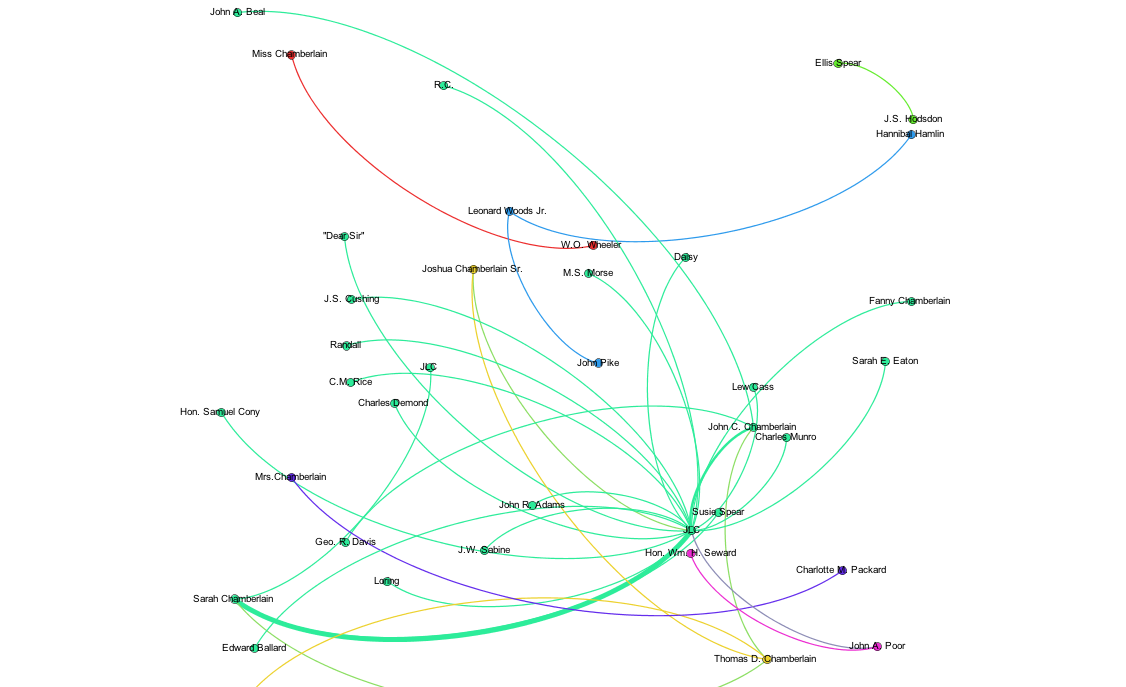
This Digital and Computational Studies Workshop is open to both students and faculty. Discover how social network analysis can answer questions in the social sciences, humanities, and sciences. The workshop will focus on the 2016 Election. Participants will learn about campaign finance networks and basic network analysis concepts. People can also work on their own network data.


Digital and Computational Toolbox: Gephi

November 3, 2015 By Gabriella Papper '18

Gephi is an interactive visualization platform. It forms network connections based on the relationship of data inputs. Gephi is open-source, which means that anyone can access it and users can also help improve the Gephi’s design and functionality. Gephi can generate data visualizations for different kinds of networks, graphs, and complex systems. Gephi enables you to create visual representations of data that could uncover hidden network connections. Users can then understand the intricacies and underlying trends in graphs. The two basic elements of Gephi visualizations are nodes (essentially a data point) and edges (connection between two or more nodes).

Gephi is already being used in DCS classes and projects at Bowdoin. This fall, students in Introduction to Digital and Computational Studies (INTD 1100) used Gephi to visualize Joshua Chamberlain’s correspondence network. The visualizations below represent Chamberlain’s overall correspondence during the Civil War. Students visited Bowdoin’s Special Collections and Archives to see the original Chamberlain letters and then created data visualizations in Gephi.

CivilWar2 CivilWar1

Further Reading: Visualizations and Historical Arguments by John Theibault.

Installation: #CarbonFeed by John Park & Jon Bellona

April 1, 2015 By Hannah Rafkin '17

#CarbonFeed

Reception: Monday, April 13 from 7 – 8 PM in Daggett Lounge

Installation on view at the Hawthorne-Longfellow Library from April 13 – May 13

Photo by John Park
Photo by John Park

#CarbonFeed is a new media project that challenges the perception that the online world is disconnected from physical reality. Artists John Park and Jon Bellona reveal the environmental consequences of online activity by visualizing carbon emissions triggered by tweeting, sonifying Twitter feeds and correlating tweets with data visualization.

#CarbonFeed encourages the Bowdoin community to participate in the instillation by tweeting #carbonfeed and #bowdoin from April 13 – May 13. Your tweets will trigger the installation to emit 0.02g/C02e.

Learn more about #CarbonFeed, John Park, and Jon Bellona.


Project supported by Lectures and Concerts and through contributions from DCSI, Visual Arts, Music, Art History, Environmental Studies, Physics, and Government.

Digital Image of the City: Smart City Recommendations for Portland, Maine

December 11, 2014 By jgieseki

In the Digital Image of the City, taught by Jack Gieseking, students were tasked with identifying an issue in the City of Portland related to the topic of housing, infrastructure, or public space. They then conducted qualitative field research and learned the geographic information systems (GIS) open-source platform QGIS. As over half the world’s population now dwells in cities, revolutionary advances in technology such as big data have caused policymakers and activists alike to shift their focus toward a movement of smart urbanism. Smart urbanism includes interventions in urban issues through better uses of technology and data, from gentrification to pollution, access to public spaces to improved walkability. Students then created maps and conducted research to help them devise technological solutions to these issues.

On December 10th, 2014, the students of The Digital Image of the City shared their final smart city solutions for the City of Portland, Maine, which you can read below. Enjoy!

Bowdoin College Digital Image of the City – Housing from Department of Geography, University of Kentucky

Bowdoin College Digital Image of the City – Infrastructure (1) from Department of Geography, University of Kentucky

Bowdoin College Digital Image of the City – Infrastructure (2) from Department of Geography, University of Kentucky

Bowdoin College Digital Image of the City – Public Space from Department of Geography, University of Kentucky

Announcing the Fall Hackathon!

November 5, 2014 By jgieseki

Hackathon November 2014 e-mail


Our fall Hackathon will be held Wednesday, November 12th, from 6 p.m. to 9 p.m. on the third floor of the VAC! All Bowdoinites are welcome!


A hackathon is a space for programmers and designers, from novices to experts, to collaborate intensively on software projects. Come start or work on a project, learn a new coding language, visualize data, or how to protect your online privacy! The digital humanities and social science course students will be working on their projects, and local citizen hackers from Code4Maine (http://dash.code4maine.org/) will be in attendance as well. Faculty and students alike are invited. No prior experience is necessary.

  • « Go to Previous Page
  • Page 1
  • Interim pages omitted …
  • Page 10
  • Page 11
  • Page 12
  • Page 13
  • Page 14
  • Interim pages omitted …
  • Page 20
  • Go to Next Page »

Digital and Computational Studies Blog

research.bowdoin.edu