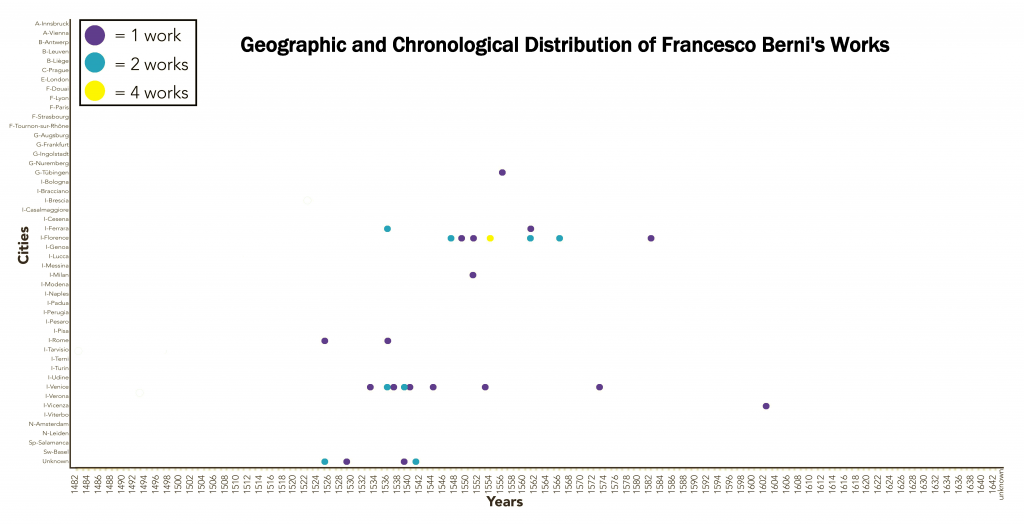
The example of Francesco Berni (1497/98-1535), one of Galileo’s favorite poets, illustrates quite well the need for more inclusive data and the immediate challenges that arise from considering aggregate geographic and temporal information. Galileo’s friends mention his love of Berni’s poetry many times in letters, and early biographers like to highlight that Galileo memorized much of his work, but no primary or secondary source indicates which, if any, of Berni’s books might have been in the library. Yet, suggesting any kind of representation of Galileo’s book collection seems irresponsibly incomplete without somehow incorporating the work of a poet and playwright who was so important to Galileo that he took the time to memorize portions of his texts. Berni’s work existed in 37 discrete editions in Galileo’s lifetime. In order to represent the geographic and chronological variability represented by these editions, I turned to the visualization of isotope behavior in chemistry as a model and heuristic. Instead of charting protons, neutrons, and stability, my chart of Berni’s early modern book isotopes tracks the range of publishing sites and years a title was in print while documenting the number of volumes that correspond to those characteristics with a color-coded gradient.
Plot of the number of books printed in various European locations in each year covered by known editions in Galileo’s library. Visualization by Hannah Rafkin.
The above scatterplot is nicely evocative of a genetic gel test, revealing as it does the components of Berni’s early modern book identity. As might be expected, publication began in Berni’s home region of Venice, increasing in the decade after his death in 1535. Interest then shifted to Florence in the subsequent ten years with only a few reprints during Galileo’s lifetime.
When considered in comparison to the scatterplot of data about known editions in Galileo’s library, the Berni data reveals the reason why relying on certain data alone is both misleading and unsatisfactory for describing the book collection.
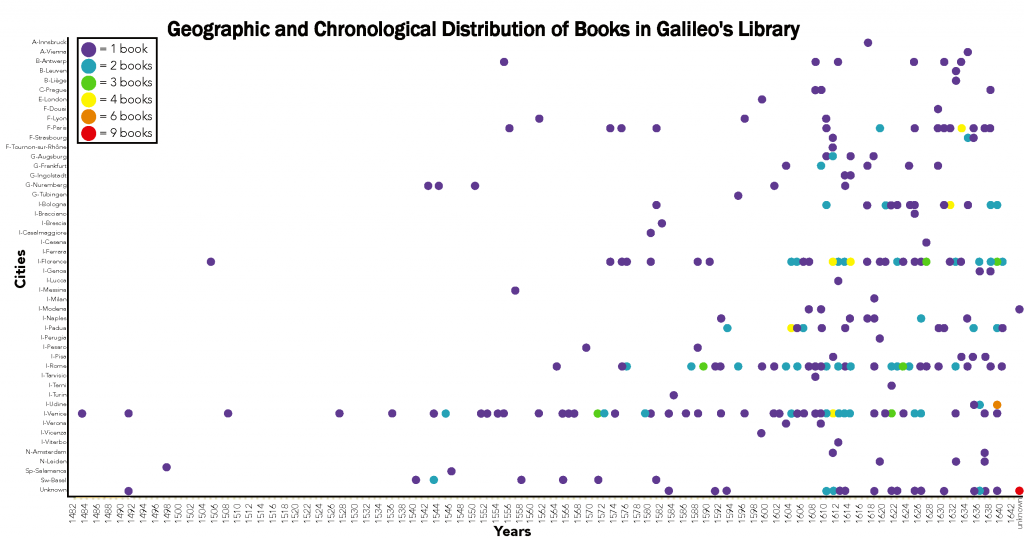
Plot of the locations in which books in Galileo’s library were published in each year covered by the collection. Visualization by Hannah Rafkin.
Berni does not fit the trend. In almost every case the data related to Berni fills a void in the data for editions in the library for which we have complete information. The half of the library for which we can specify a time and place of publication tends to be in Florence in later decades and it reflects the histogram in this sense. In almost every case the data related to Berni fills a void in the data for editions in the library for which we have complete information. The comparison emphasizes the need for, and the value of ,seeing every book as a choice, not just those for which specific edition information cannot be determined. The differences in the two scatterplots also identify the need for additional texture related to all of the available information about the library.
Textual isotopes: Margherita Costa