• Skip to primary navigation
  • Skip to main content

Digital and Computational Studies Blog

Bowdoin College - Brunswick, Maine

  • Home
  • Research Opportunities
  • Courses
  • Events
  • Faculty and Staff
  • About the DCS Blog
  • Show Search
Hide Search

Digital and Computational Studies Initiative

Under the Hood: HClust

July 28, 2016 By Professor Crystal Hall

In order to understand relationships between texts we often turn to the hclust function to create a dendrogram. This post will explain what is happening with that algorithm and how to explore its functionality with the built-in data on U.S. Cities. This tutorial can be used in conjunction with DCS 1200 “Data Driven Societies” and DCS/ENVS 2331 “The Nature of Data: Resource Management in the Digital Age”. Look for a Jupyter notebook with the R code so that you can follow along – coming soon!

One of the most frequent kinds of data used in text analysis is a distance matrix, which can be an odd configuration of information for users who aren’t used to working with a printed road atlas that would indicate the miles between different cities on a map. We’ll start with what is happening in two dimensions and then build on that to understand what is happening in the multiple dimensions of textual features that we measure.

The sample data for our function hclust considers 10 U.S. cities and we want to find pairs or clusters of cities that are similarly distant to the other cities in our data set:
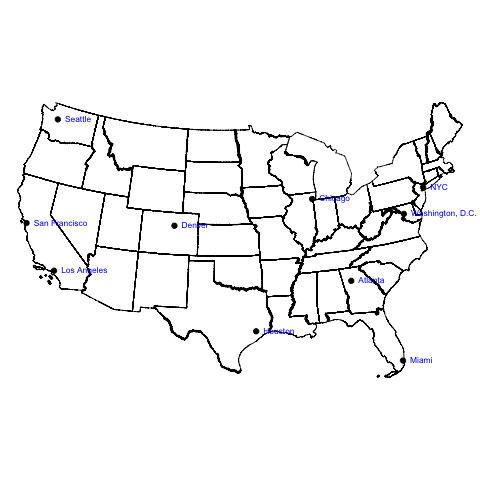
Map of the 10 cities analyzed in the hclust vignette. UTM-14 Projection.


Typically we would think about regions in order to categorize the cities: NYC, D.C. and maybe Chicago in the Northeast; Atlanta, Miami, and maybe Houston in the Southeast, etc. Hclust considers the linear distance between the points, seen here in the two dimensions of longitude (x-axis) and latitude (y-axis).


We would expect cities that are close together on the map to be similarly distant to the rest of the map. For example, San Francisco and Los Angeles on the West Coast are going to have relatively similar distances to cities on the East Coast. The distance between the cities can be represented as a matrix and we can see that San Francisco to New York is 2571 miles, LA to New York (or New York to LA in the data below) is 2451 miles, very similar:

Sample data from the hclust vignette.

What happens when we compare each city’s distances to every other city’s distances? To find pairs like the obvious San Fran-L.A. cluster, we need to find cities that have a low difference in distances to each other, which by extension means finding similarly distant cities. We can think about our distance table as a dissimilarity matrix that shows the differences between the x and y values in our data (here the Euclidean or linear distance between two points).  The lowest value will help to identify the lowest dissimilarity, which establishes the first pair in the cluster.

Sample data from the hclust vignette with the lowest dissimilarity value indicated in red.


You will see that when we visualize the city clusters below in the final image, the New York – Washington, D.C. pair is together with a cluster height of 205 (indicated by a dashed red line). We can reduce our distance matrix to fewer columns by combining NY and DC. Using the complete or maximum linkage method we will keep the highest distance value to every other city in the data:

Distances from New York and Washington, D.C. to other cities. Maximum distance highlighted in red.

Our new distance matrix with the NewYork-DC cluster will look like the one below. Then we must keep searching for similarly distant pairs by finding the next two cities with the lowest distance between one another:

Distance matrix showing the new NewYorkDC cluster with values from above and the data that will determine the next cluster (circled in red).

Los Angeles and San Francisco will appear as a cluster connected by a horizontal bar at height 347 to indicate their dissimilarity. Once we repeat these steps a few times, our most similar (or least dissimilar) pair will be a pair of clusters:
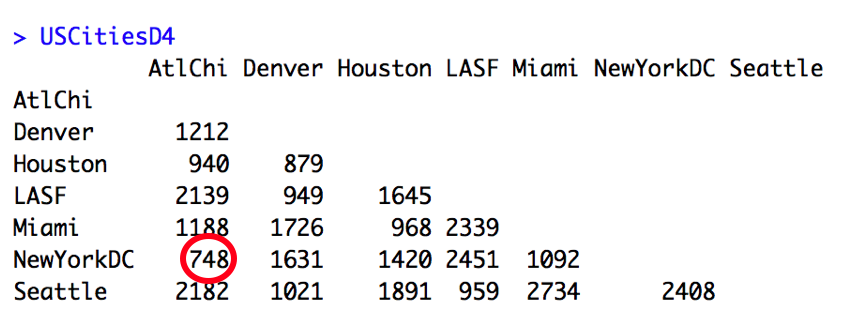
Distant matrix showing that the Atlanta-Chicago and New York-Washington, D.C. clusters are the next closest pair.

This means that the Atlanta-Chicago and New York-Washington, D.C. clusters will be joined by a horizontal bar at the height of 748 to indicate their dissimilarity (distance). When we put everything together to view these clusters in a dendrogram, we can see these similarly distant pairs:
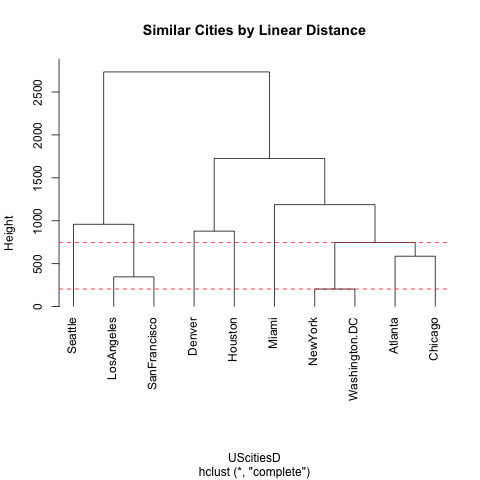
Dendrogram showing hierarchical clustering of US cities based on linear distance. Red bars highlight the height of the NY-DC cluster (the distance between the cities) and the height of the NY-DC, Atlanta-Chicago cluster (the maximum distance between any two members of the larger cluster).

We have rearranged our longitude-latitude (our x-y) data in such a way as to see new relationships. What happens when we apply this method to textual features? Instead of longitude on the x-axis, we might plot the relative frequency of the most frequent word (MFW) in our texts, and on the y-axis the relative frequency of the second most frequent word, and thanks to computation, we can continue this for 100 or 200 features (MFWs) into 100 or 200 dimensions. The algorithm then identifies the documents that are similarly distant, based on the same math that we have just outlined here. (You have seen this demonstrated in class and lab, but for another example, in a non-English language, see Prof. Hall’s work on computational parallax.) The biggest challenge is that we know a lot about the geographic space that separates cities and influences the features of those cities (although there is still much to learn), but we are only just starting to explore this computational aspect of the multi-dimensional space of texts.


Pamela Fletcher Interviewed for LARB “The Digital in the Humanities” Series

July 12, 2016 By Professor Crystal Hall

In March 2016 journalist Melissa Dinsman began a new series for the Los Angeles Review of Books (LARB): “The Digital in the Humanities.” In late June LARB published Dinsman’s interview with Pamela Fletcher, Professor of Art History at Bowdoin and one of the founding co-directors of DCS. Professor Fletcher’s remarks highlight the value of humanistic inquiry of digital methods and objects as well as the ways in which a computational or digital approach can reshape the questions we ask of cultural objects. The piece is pleasantly provocative reading after the flurry of debate that surrounded an earlier LARB piece on digital humanities, which can be found along with links to responses in a summary post by dh+lib.


Origin of Digital and Computational Studies at Bowdoin

May 20, 2016 By Gabriella Papper '18

Assembled by Crystal Hall, Associate Professor of Digital Humanities, Co-Director of DCS 2015- and Gabriella Papper ’18, DCS Teaching Assistant, Research Assistant, and course alumna

Digital and Computational Studies began in Fall 2012 after a meeting of the Bowdoin College Board of Trustees. Several faculty members from multiple disciplines joined a steering committee charged with this curricular initiative. Through a series of satellite meetings with colleagues from the humanities, social sciences, and physical sciences, they discussed the place of computation and digital disruption in a liberal arts environment. With the steering committee’s guidance, 2012-2013 marked the inaugural year of the “Computation and the Liberal Arts Colloquium,” which included events representing the fields of art history, biology, classics, computer science, mathematics and visual arts. In Spring 2013 co-directors Eric Chown and Pamela Fletcher announced the first DCS course: “Gateway to the Digital Humanities.” A student assistant for the course developed the first version of the DCS logo, which has undergone at least three iterations in the intervening years.

DHWiki logo DCSlogo2015


By Fall 2014 there were five courses on the books, including three that were part of the Digital Humanities Course Cluster, a Mellon Humanities Initiative. Thanks to tremendous faculty and student support, in 2014-2015 DCS was able to move beyond just the humanities to connect students across disciplines through computational thinking, data analysis, critical interrogation and design of digital resources, and the understanding of the ways that technological changes are impacting everyday life. Former Bowdoin College President Barry Mills ’72 summarized this change in one of his departing reflections on the College: “So, what’s different about Bowdoin’s approach? Unlike other colleges and universities, at Bowdoin we are incorporating this mode of inquiry throughout the disciplines.”

President Mills concluded that piece by saying: “This isn’t about being  “relevant”; it is about educating our students to be informed, thoughtful citizens who can lead their communities—the age-old purpose of the liberal arts.” Incoming President Clayton Rose, asked many questions on this theme in his Opening of the College remarks at Convocation in Fall 2015: “What should a Bowdoin liberal arts curriculum be in five years, for the next 10-15? In particular, what will it mean to be “liberally educated” at Bowdoin in the future? What is great teaching? What is profound learning? What makes both possible? What roles should athletic, cultural, service, and other experiences play in complementing the intellectual engagement here? What role should technology play in both what we teach and how we teach?”

The faculty members and steering committee for DCS had been investigating these questions throughout the 2014-2015 academic year while developing a more expansive introductory course for this new field of study. DCS 1100 marked a new beginning for the program: an articulation of a core suite of tools and topics. Students worked with computation in Python, spatial analysis with ArcGIS, network analysis with Gephi, and structured markup of data with XML. Topics for readings and projects primarily addressed the theme of what it means to study an individual using digital resources. The course is oversubscribed for Fall 2016.

We invite you to explore the other courses and events that have been offered as part of DCS!


Oracle MySQL Tutorial

May 18, 2016 By Gina Stalica '16

This tutorial comes from the official MySQL website, which is technically under the ownership of Oracle.  Oracle is a global software and technology company, whose services are widely used – likely by many of the technologies you use every day.  MySQL alone is used to power the functionality of Twitter, Facebook, YouTube, and much more.

Screen Shot 2016-03-30 at 10.23.50 PM

While the MySQL documentation available on this site extends far, far beyond its tutorial, the tutorial itself can be found here.  Oracle offers users very direct walkthroughs of connecting to the MySQL server, creating and using databases, entering queries, getting information about databases, using MySQL in batch mode, and using MySQL with Apache.  The guidance is straightforward, yet thorough, but it certainly assumes a certain level of user knowledge.

Pros:

  • Reputable:  Since Oracle created MySQL, the company certainly knows MySQL best.  This is the most reliable MySQL resource available.  This is especially important to users who may be troubleshooting, as the site is far more likely to be correct than your average StackOverflow post.
  • Straight to the point:  As was mentioned, Oracle knows how MySQL should work better than any other resource.  This tutorial is reliable without any excess information.
  • Thorough directions:  Though the tutorial is straightforward, it does cover all of the essential information needed to get started with MySQL – and, likely, needed to fix certain problems that even seasoned database designers may need.  With every explanation comes an example straight from the
Oracle provides useful examples
Oracle provides users with useful examples

Cons:

  • Straight to the point:  One may notice that this very quality was also listed as a “Pro.”  Oracle assumes that users have an understanding of such topics as batch mode and Apache.  It does not take time to explain anything extremely thoroughly, which may prove to be limiting to users who are new to programming or MySQL.
  • Only command line documentation:  This tutorial will really only be useful for those who are looking to use MySQL from the command line in a Linux/Unix or Windows environment.  Anyone who is looking to use MySQL largely from a GUI (a Graphic User Interface, like Sequel Pro or Windows MySQL Workbench) will benefit from other resources.

tl;dr?  Oracle provides a reliable, straightforward tutorial for connecting to MySQL server, creating and using databases, entering queries, and more, all in a Unix/Linux environment.  For users who are looking to use databases using a GUI, other resources will likely be more helpful.

Research and Internship Opportunities

May 4, 2016 By Professor Crystal Hall

Conferences and summer internships are two instructive ways to gain more experience in the field of digital humanities outside of the classroom. Upcoming opportunities include:

The Association for Computing Machinery Special Interest Group on the Design of Communication has a call for proposals for the Student Research Competition. Selected undergraduate and graduate students will present their individual research at the conference to judges and attendees. The topics of interest include, but are not limited to: communication design, user experience, information design, and learning systems/environments. Learn more about the conference and competition here: http://sigdoc.acm.org/conference/2016/student-research-competition/.

The Berkman Center for Internet and Society at Harvard University has positions for full-time summer interns. Interns work on various projects that explore the intersection of technology and communication in a collaborative environment. Interns can join research teams in areas such as academic innovation, law, computer science, and open access projects. The Berkman Center also hosts intern discussion hours and events with the larger Berkman community. Specific research projects available to interns can vary each summer. Learn more about the internship: http://brk.mn/summer.

The Social Computing Lab at Carnegie Mellon University has a Research Experience for Undergraduates (REU) program. This summer program offers research assistant positions in the fields of psychology, computer science, human-computer interfaces and language technologies. The 10 week long summer research exposes a diverse group of undergraduates to academic research in a modern research lab setting. There will also be seminars for students participating in REU in addition to Social Computing Lab seminars and those held by Carnegie Mellon’s Human Computer Interaction Institute and Language Technologies Institute. Program Details and Application Instructions Available here: https://hciisocialcomputing.wordpress.com/summer-reu-program-description/

Keep an eye on these sites in Winter 2016 for a Summer 2017 opportunity:  http://data.betaworks.com/ (they announced a 2016 summer internship with applications due Jan. 18, 2016)

http://librarylab.law.harvard.edu/fellows (they announced a 2016 summer internship with applications due by April 27, 2016).

  • « Go to Previous Page
  • Go to page 1
  • Interim pages omitted …
  • Go to page 4
  • Go to page 5
  • Go to page 6
  • Go to page 7
  • Go to page 8
  • Interim pages omitted …
  • Go to page 10
  • Go to Next Page »

Digital and Computational Studies Blog

research.bowdoin.edu