• Skip to primary navigation
  • Skip to main content

Digital and Computational Studies Blog

Bowdoin College - Brunswick, Maine

  • Home
  • Research Opportunities
  • Courses
  • Events
  • Faculty and Staff
  • About the DCS Blog
  • Show Search
Hide Search

Student Research

Undergraduate Network for Research in the Humanities

December 10, 2015 By Gabriella Papper '18

The Undergraduate Network for Research in the Humanities is a student-created and student-run conference. A group of undergraduates had attended other Digital Humanities conferences in the past, but felt as though those conferences did not give students enough time to discuss research projects, methods, and tools directly with one another. As a result, the Undergraduate Network for Research in the Humanities was created to give students the space to present research projects to one another and to encourage future collaboration between the participants. Participants have the chance to bring what they discussed at the conference back to their respective colleges in order to contribute to the growth of digital humanities.

This past November, I was selected to attend the inaugural conference along with one other Bowdoin student at Davidson College in North Carolina. The first session was titled “Speed Dating” and all the attendees had two minutes to share key findings from their research and explain the digital and computational tools used in their project. I was excited but also surprised to learn about the breadth of research possibilities across many different institutions (each college’s digital humanities program seems to be run somewhat differently, although there are certainly discernible overlaps). The range of projects included digitizing an ancient tomb, studying ethnography through digital sound, and creating an interactive timeline of the Earl of Essex. Since the field is still so new and is only going to continue to grow, attendees were able to build on the knowledge of other students by sharing diverse research projects that employed a wide range of digital and computational tools.

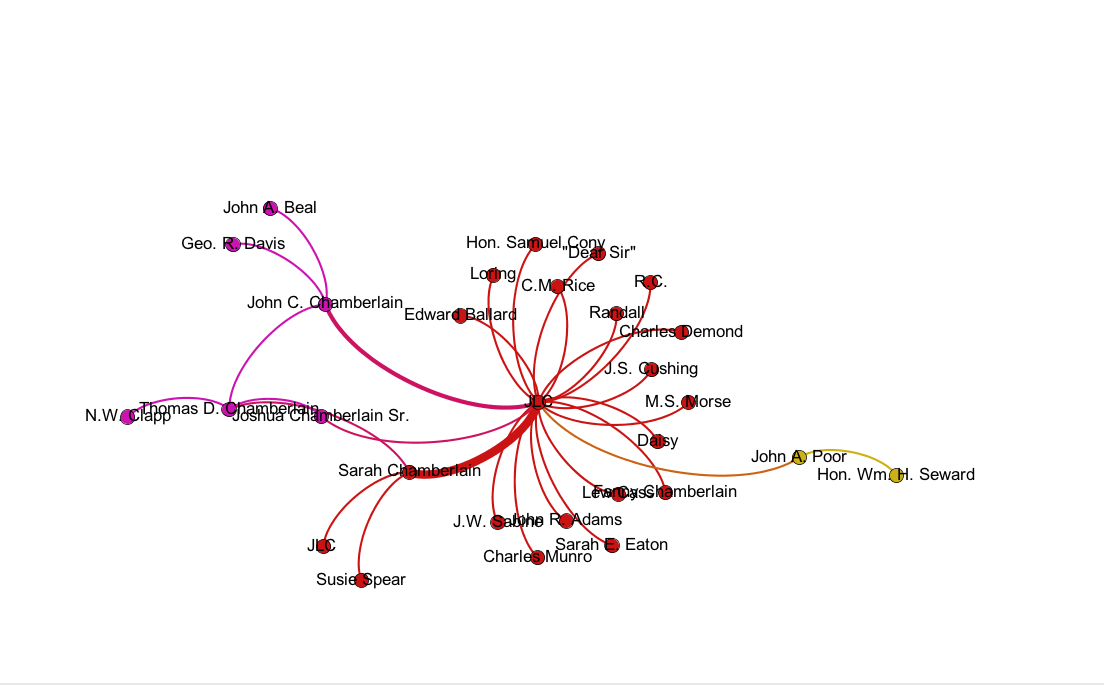
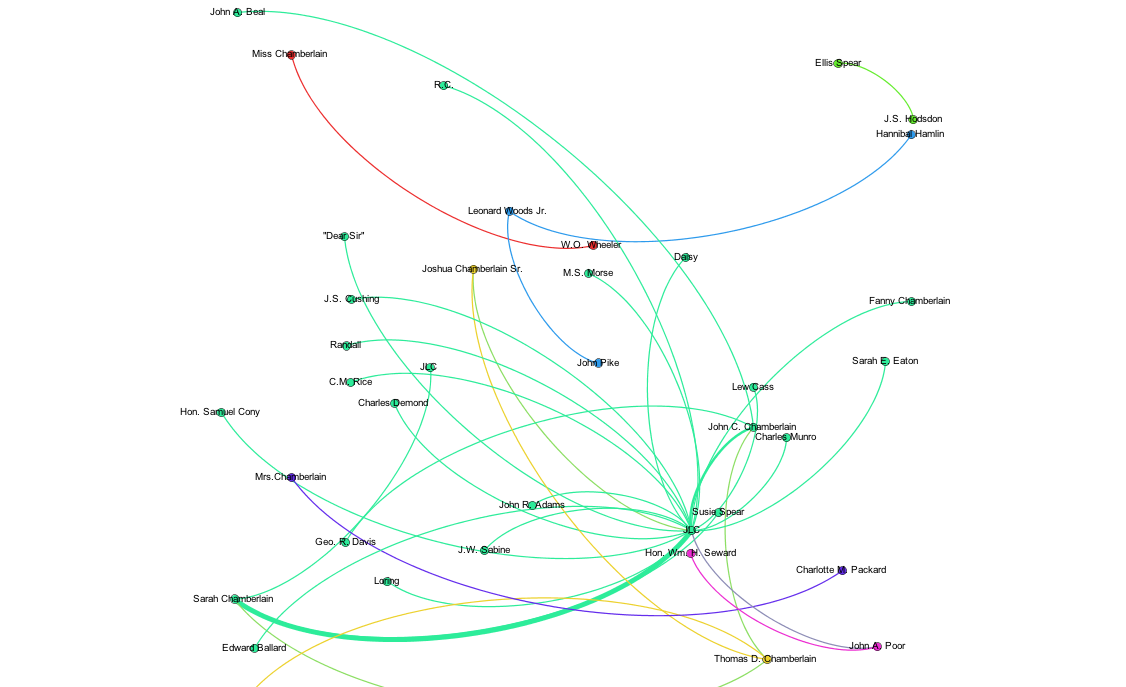
I was able to present the research that I had worked on with Professor Hall this summer as one of the six longer presentations. The project is titled, “What Could Joshua Chamberlain See at Gettysburg?” and explores the relationship between present and historical narratives using computational tools such as Gephi and arcGIS.

Later in the conference, Keynote Whitney Trettien gave a talk titled Off the Books: Digital Futures. She discussed her own path through the field of digital humanities, and it was extremely informative to see where our work in this field could lead after graduation. She also emphasized her desire to balance physical books and digital ones throughout her work.

The conference served as an ideal starting point to collaborate with other students and learn more about digital humanities that I could then apply at Bowdoin. At the end, there was a design thinking session titled “How might we re imagine the undergraduate humanities research model in the digital age?”, which encouraged everyone to think about what research could look like going forward. The attendees are still in communication with one another and I think there is a great possibility for future undergraduate collaborations in the digital humanities.

Digital and Computational Toolbox: Gephi

November 3, 2015 By Gabriella Papper '18

Gephi is an interactive visualization platform. It forms network connections based on the relationship of data inputs. Gephi is open-source, which means that anyone can access it and users can also help improve the Gephi’s design and functionality. Gephi can generate data visualizations for different kinds of networks, graphs, and complex systems. Gephi enables you to create visual representations of data that could uncover hidden network connections. Users can then understand the intricacies and underlying trends in graphs. The two basic elements of Gephi visualizations are nodes (essentially a data point) and edges (connection between two or more nodes).

Gephi is already being used in DCS classes and projects at Bowdoin. This fall, students in Introduction to Digital and Computational Studies (INTD 1100) used Gephi to visualize Joshua Chamberlain’s correspondence network. The visualizations below represent Chamberlain’s overall correspondence during the Civil War. Students visited Bowdoin’s Special Collections and Archives to see the original Chamberlain letters and then created data visualizations in Gephi.

CivilWar2 CivilWar1

Further Reading: Visualizations and Historical Arguments by John Theibault.

Digital Image of the City: Smart City Recommendations for Portland, Maine

December 11, 2014 By jgieseki

In the Digital Image of the City, taught by Jack Gieseking, students were tasked with identifying an issue in the City of Portland related to the topic of housing, infrastructure, or public space. They then conducted qualitative field research and learned the geographic information systems (GIS) open-source platform QGIS. As over half the world’s population now dwells in cities, revolutionary advances in technology such as big data have caused policymakers and activists alike to shift their focus toward a movement of smart urbanism. Smart urbanism includes interventions in urban issues through better uses of technology and data, from gentrification to pollution, access to public spaces to improved walkability. Students then created maps and conducted research to help them devise technological solutions to these issues.

On December 10th, 2014, the students of The Digital Image of the City shared their final smart city solutions for the City of Portland, Maine, which you can read below. Enjoy!

Bowdoin College Digital Image of the City – Housing from Department of Geography, University of Kentucky

Bowdoin College Digital Image of the City – Infrastructure (1) from Department of Geography, University of Kentucky

Bowdoin College Digital Image of the City – Infrastructure (2) from Department of Geography, University of Kentucky

Bowdoin College Digital Image of the City – Public Space from Department of Geography, University of Kentucky

Student Research from Data Driven Societies (Spring 2014)

August 26, 2014 By jgieseki

In the spring of 2014, I (Jen Jack Gieseking) taught Data Driven Societies with Eric Gaze. A geographer and a mathematician, a social scientist and a natural scientist, working together with 35 students with very diverse backgrounds and interests sought to answer one question: what can data visualization reveal and obscure about the world’s increasing obsession with all things data?

Students selected a social justice hashtag of their choice that related to issues of identity, privacy, economics, politics, or the environment. Over a month, students scraped Twitter data on their hashtag. A hashtag is a term with a # in front of it that hyperlinks to all uses of the term that can range from #stopandfrisk and #smog to #gobears. As students read media and conducted research about the issue they had chosen to study, they also began to create graphs, maps, and network analyses from the Twitter data as well as a related dataset they had to find and bring to class. Students left the class with not only a basic understanding of software such as Excel, R, Social Explorer, CartoDB, and Gephi, but also a much more critical eye on the procurement, organization, and manipulation of data.

The outcomes were impressive and inspiring. Many of the students agreed to share their papers and/or presentations publicly, all of which are listed below or you can scroll through them at your leisure. Besides the work by students below, we share our course description as well. We hope you enjoy them as much as we did making them!

Links to student work:

  • #BigData – More than Just a Buzzword? :: Matthew Glatt ’14
  • Lack of Women in Leadership via #Women Lead :: Rita Chengying Liao ’16
  • #Wearable Technology :: Ruben Martinez ’15
  • Visualizing #Smog via Twitter :: Alana Menendez ’15
  • The #TeaParty in the Context of Group-Centric Theory :: Zachary Morrison ’14
  • Making Sense of #OceanAcidification on Twitter :: Jordan Moskowitz ’16
  • The World Economic Forum – Deciphering Connections to Find Effect Policy Solutions :: Gregory Piccirillo ’17
  • Visualizing #StopandFrisk :: Anna Prohl ’14
  • Twitter is for Connecting about #LGBT Issues…or Not :: Eva Sibinga ’17
  • Visualizing the #NSA through a Diverse yet Unified Public :: Emily Simonton ’15
  • #Tor, or the Limits of Visualizing the Anonymous Web :: Gina Stalica ’16
  • #Euromaiden – The Power of Digital Activism :: Jimin Sung ’14
  • Closing the Gap between Geographic Inequalities with Obamacare :: Samuel White ’16
  • Visualizing #Priviliege and the Real World Implications of Data Analysis :: Lily Woodward ’17

Course description:

Big data and computational methods, such as changes in social media privacy laws and advances in mapping and network analysis, are changing financial markets, political campaigning, and higher education and becoming commonplace in our lives. Our daily existence is increasingly structured by code, from the algorithms that time our traffic lights to those that filter our search criteria and record our thoughts and ideas. In this course, we explore the possibilities, limitations, and implications of using digital and computational methods and analytics to study issues that affect our everyday lives from a social scientific approach. We pay special attention to the ways we collect, trust, analyze, portray, and use data, most especially the tools and meanings involved in data visualization and modeling.

This course tackles a number of cutting-edge issues and questions that confront society today: What sorts of questions can be asked and answered using digital and computational methods to rethink our relationships to data and what can data can show us about the world? How do we construct models to help us better understand social phenomena and associated data? What is data, and how do we know it’s reliable? How do these methods complement and sometimes challenge traditional methodologies in the social sciences? Students will leave the course with both substantive experience in digital and computational methods, Students will learn how to apply a critical lens for understanding and evaluating what computers can (and cannot) bring to the study of society.

Visualizing #StopandFrisk :: Anna Prohl ’14

August 26, 2014 By jgieseki

Anna Prohl ’14’s paper and slides on her research into “Visualizing #StopandFrisk.” This work is part of the Data Driven Societies course taught in Spring 2014 by Eric Gaze and Jen Jack Gieseking.

Presentation stopand frisk from akprohl

[gview file=”https://research.bowdoin.edu/digital-computational-studies/files/2014/08/Prohl_StopandFrisk.pdf”]

  • « Go to Previous Page
  • Page 1
  • Interim pages omitted …
  • Page 4
  • Page 5
  • Page 6
  • Page 7
  • Page 8
  • Page 9
  • Go to Next Page »

Digital and Computational Studies Blog

research.bowdoin.edu